This has certainly been a highly uncertain presidential election season, and more importantly, a rather depressing one.

However, I’ve posted election day predictions here for each of the last several presidential elections. And I’ve noted when my predictions were accurate (50 of 50 states in 2012, 49 of 50 in 2008). So I think it’s only fair that I do the same again this year.

Here is how I see the election as of this morning:

electoral-map-2016-blog

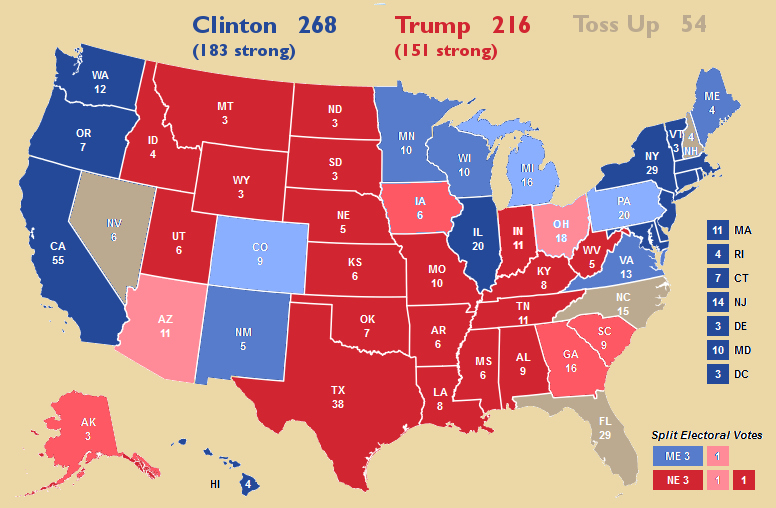
I tend to side with Nate Silver about this year’s presidential race: the election outcome is significantly less certain than many analysts are claiming. There are essentially two related reasons for this uncertainty:

  1. Because of the unusual nature of this election (two highly unpopular and polarizing candidates, including one who is especially unconventional and controversial), the polls have been consistently far more varied and volatile than in other recent presidential elections.
  2. For those same reasons, we have especially good reason, this time around, to suspect that our assumptions about voter turnout and demographics, used to craft and interpret polling results, may be inaccurate in ways we can’t predict (and can’t even estimate; that is, we don’t know how much we don’t know).

That latter point means that we don’t really know, for instance, the extent to which mainstream Republicans will break for Trump, cross party lines, or simply stay home. We don’t know how many Democrats (especially white, male, and working-class) may cross party lines for Trump or stay home. We don’t know how many voters have been reluctant to tell pollsters the truth about their voting plans, which may cross party and other lines, and seem risky to reveal to others. We don’t know the impact of Trump’s motivational impact on his supporters, but lack of a solid ground game to turn out the vote, on the composition of the electorate.

This is a hasty sketch of several of the most important issues in play. In any event, the electoral map above reflects this uncertainty. The impact is that, while I agree that Clinton has a distinct advantage tonight, I believe Silver is right when he suggests there is more uncertainty than many analysts will admit, such that Trump has a real chance at winning the White House, and Clinton has a real chance at a strong victory in the electoral college.

If pressed, what do I think is the most likely outcome? It’s this:

electoral-map-2016-blog-prediction

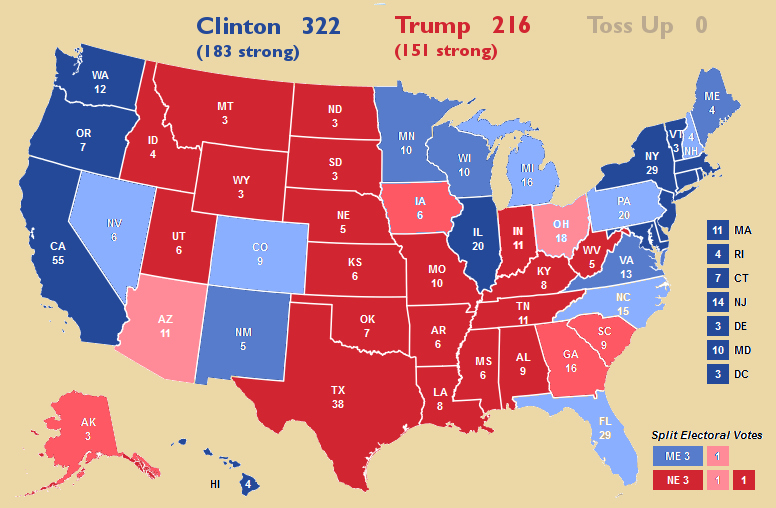
But I will be looking very, very closely at the early returns tonight, for any hints as to whether, and in what ways, our assumptions have proven wrong this time around.

Once again, Bob Vanderbei of Princeton has offered the nation a view of itself as the purple country that it is:

The purple United States 2012

As I mentioned four years ago, this is a much more accurate and revealing look at the nation’s geographic political divisions than the more conventional state-by-state, red-and-blue map. It emphasizes how politically diverse many states are, and how there are red, blue, and purple areas throughout the country.

The county-level data revealed by this map also hints at an important truth that state-by-state color-coding doesn’t: that in terms of geography, our society’s political leanings track closely with not only broad geographic areas, but also with coastal and inland terrain and with urban and rural settings.

[P]olitics is a field perfectly designed to foil precise projections. … You can’t tell what’s about to happen.

David Brooks on the 2012 presidential election, New York Times, October 23

As of this writing, my state-by-state projection of the presidential election outcome is 49 for 49. If Florida, the only state I said was a close call, ends up in Obama’s column, that record will improve to 50 for 50.

This result says little about my own predictive abilities, however, and a great deal about the ability of political science to make meaningful predictions and to understand the fundamental factors driving presidential election outcomes.

My electoral college projection, 2012

My 2012 electoral college prediction, as posted here on the morning of the election

What quick lessons can we draw here?

Click here to read the rest of this entry

In recent presidential elections, I’ve publicly posted my analysis and predictions ahead of the voting. While I’m no longer blogging here, in order to concentrate on my work at the Tracing Center, I thought it would only be fair to put myself on record again.

(Last year, for reference, I correctly predicted 49 of 50 states. The state I missed was Indiana, which I saw narrowly going to McCain.)

Here is now I see the electoral map and the state of the presidential election, before we begin seeing returns today:

Electoral college map (analysis)

How controversial is this analysis? Not very, if you look at the work of respectable political analysts and political scientists. On the other hand, if you’ve been listening to the “mainstream media,” you might have the mistaken impression that Romney had been experiencing momentum since the first presidential debate, and that the race was currently too close to call.

In fact, President Obama has a commanding lead in the electoral college, and probably a slim lead in the popular vote, as well. As the map indicates, he seems to have enough states sewn up to win a majority of electoral college votes, and is on track for a bigger victory than required. There seem to be few battleground states left in play, and only Florida appears to be a true toss-up.

What are Romney’s chances at this point? Not very good, but he still has a chance. To win, however, would require either surprising events on the ground in key battleground states, blocking relatively large numbers of voters from casting their ballots, or for most the state polls to have been systematically biased (“skewed”) against him.

Political scientists and survey experts worry quite a bit, in fact, that the national and state polls could be biased against one candidate or the other, especially in an age of very low response rates and high cell phone usage among younger voters.

However, it’s worth noting two facts here. First, we have rich polling data in all the battleground and marginal states. While individual state polls can and do vary quite a bit (statistical “noise”), averages of late state polls in presidential elections are historically very, very successful at predicting winners. And there has been no noticeable trend away from this success in recent years.

Second, the risk that the state polls are biased cuts both ways. Pollsters and analysts have to make assumptions in analyzing voter responses, and they could be making the wrong assumptions, but they have been very conscious that they could be making assumptions that overstate the president’s support among voters. (This has been especially true in recent months, as until the last week or so, the national poll numbers have consistently shown Romney performing better than the state polls would suggest.) As a results, reputable pollsters have been trying to adjust their assumptions to balance the risk of over- and under-stating either candidate’s performance, and it would seem just as likely that they have erred in one direction as another.

Finally, here is my projection of tonight’s election results:

Electoral college projection

This is the electoral map where I force myself to call every single state. As the first map indicated, I see very few closely contested states this year, and all but one of those states exhibits a distinct “lean,” making this projection straightforward (if inherently risky).

The sole exception is Florida. As of today, Florida seems as if it’s headed for an automatic recount. If either candidate performs better than that in Florida, I think it could be either one. It will all depend on the ground game there, and on whether Obama’s apparent momentum in the national polls, in the wake of Hurricane Sandy, has crested or is still peaking.

Conservative commentator Armstrong Williams has a perplexing column in tomorrow’s Washington Times in which he claims that with the election of Barack Obama, “all the ‘-isms’ that were born from racism, reparations, and white guilt are now dead and buried.”

Click here to read the rest of this entry

At last, after more than two weeks, we have the final results of the presidential election:

I don’t mind saying that I correctly predicted 49 out of 50 states.

Click here to read the rest of this entry

Here, courtesy of Robert J. Vanderbei of Princeton, is the current electoral map of the United States:

Click here to read the rest of this entry

While several results remain too close to call this morning, I think it’s time to post an indication of where the races stand at this time.

Click here to read the rest of this entry

Major networks are now calling Florida, Nevada, and Colorado for Obama.

These states bring Obama to 338 electoral votes, with 53 electoral votes still up for grabs (in Indiana, Missouri, and North Carolina) and the lingering possibility of a minor upset in Montana.

With the closing of the polls on the west coast, the networks are finally willing to acknowledge that the exit polls in several of those states are enough to easily put Barack Obama over the top, with at least 284 electoral votes.

Separately, Virginia has now been called for Obama, giving him another 13 electoral votes. There are several states still to be heard from, and Obama is probably not done winning states tonight.

The updated election map:

Next Page »